
Manufacturing Day Data: One Page, Several Reference Periods
2026-11-02
Manufacturing Day Data: One Page, Several Reference Periods
A current industry event page can point to statistics from several different periods. That is not necessarily an inconsistency: the page and each linked data product have different purposes. The U.S. Census Bureau’s 2026 Manufacturing Day resources offer a concrete example for robotics data editors who also follow the wider manufacturing environment. This article checks the official pages on November 2, 2026. It does not calculate robot adoption from manufacturing statistics or present a newly assembled market dataset.
The event date belongs to the event
The Census Bureau’s Manufacturing Day page is dated September 23, 2026, and identifies Manufacturing Day as October 2, 2026. It directs readers to economic indicators, annual data, visualizations, and other manufacturing resources. The event date explains the publication context; it does not make every linked observation a measurement taken on that date.
A robotics editor can use the page as a route into the wider industry context. The editor should still identify the actual data product before borrowing a statistic. A link collected for an event remains a link to a particular source, with its own reference period and subject.
The annual-data directory contains different statistical objects
The Bureau’s annual manufacturing data directory lists several products, including surveys and business statistics with different descriptions. It is a directory of resources rather than a single table whose entries can be combined without further reading. Finding two products on the same page does not establish that their populations or measures match.
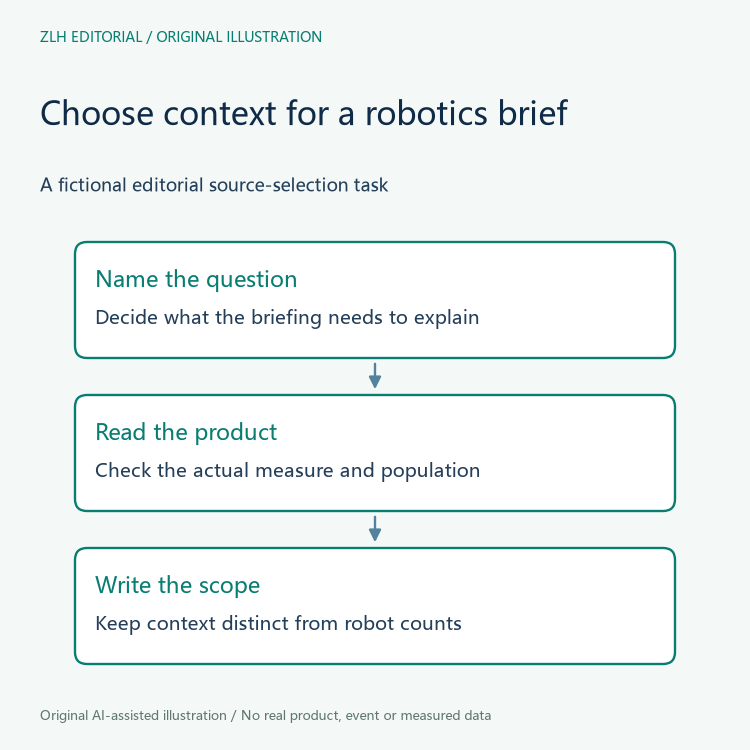
For a hypothetical editorial exercise, imagine receiving a page reference and the instruction “add current manufacturing data.” The first useful response is to ask which question the briefing needs to answer. Employment, establishments, and investment are different topics. Selecting a source should follow that question, rather than whichever link appears first.

A reference period needs its own label
Suppose the fictional editor finds a historical annual product through the current directory. Its historical period should remain visible when summarized. A new webpage visit does not refresh the underlying observation. The editor can record the access date separately, so another reader understands both when the source was consulted and when the data applies.
This distinction becomes especially helpful in a presentation that combines news and background. A current event heading may sit above a chart using earlier data. That arrangement can be legitimate when clearly explained. It becomes misleading if the heading causes readers to infer that every value describes the event year.
Our example supplies no numerical table because none is needed to explain the labeling problem. An invented sequence of annual values would create another dataset requiring explanation while adding no evidence about the real source. The illustrations use relationships and questions instead of simulated statistics.
Manufacturing context is not a robot installation count
A robotics briefing may legitimately discuss the manufacturing sector around robot users. It should not rename a general manufacturing measure as robot demand or robot deployment. Those are separate concepts. A source that describes businesses or capital expenditure cannot automatically answer how many robots were installed.
If an editor proposes using a manufacturing statistic as context for a robotics question, the relationship should be stated as an interpretation. The source still needs its original measure and scope. A reader should be able to distinguish the statistic itself from the editor’s reason for placing it in the briefing.
The hypothetical desk might decide that a resource does not answer its current question. That is a useful outcome, not a failure to find enough content. Keeping an unsuitable measure out of a chart can be more informative than filling every space with a vaguely related figure.
Build a small source note before building the slide
A proposed source note can identify the resource, the question it answers, its reference period, and any unresolved scope issue. These are editorial suggestions for the example, not a new Census reporting rule. They give the next editor a way to understand why a particular link was selected.
The note can also explain what has not been done. If only the directory was reviewed, do not claim that every linked file was downloaded and checked. If a full data analysis is later undertaken, it should have its own methods and source records. This article has only examined the two public resource pages it cites.
The useful lesson from an event-driven resource collection is that publication context and measurement context can coexist without being identical. Making both visible allows current news to point readers toward historical evidence without silently changing that evidence’s date.
More discussion appears in our robotics data interpretation section and the reading directory. Both original diagrams are qualitative. They contain no Census table reproduction, inferred robot count, or invented data series.